Understanding Diagnostics – don’t confuse them with surveys…

People often confuse Diagnostics with surveys. That can lead to them missing out on the true insights and power that Diagnostics possess.
Online Diagnostics are the means by which Value Management is delivered.
They unlock the Alignment, Resilience and Coherence that’s so necessary for us to succeed (and why you’ll see us refer to “ARC Diagnostics”).
Without Diagnostics, people can’t be engaged with the speed, security and scale needed to effectively deploy Value Codes and harness the insights and expertise those people possess.
But the term “diagnostic” is rarely understood properly.
And with these misunderstandings, huge opportunities for transformation get missed.
So what do people get wrong? Why do they get these things wrong? And why does this all matter?
To begin with, we need to understand what makes a “diagnostic” a “diagnostic”.
A Diagnostic is not a survey
The first thing to say about what makes a diagnostic a diagnostic is what it’s not: a Diagnostic is absolutely not a survey.
People often use the words “diagnostic” and “survey” interchangeably, but this needs to stop.
Yes, the interface may look superficially similar – a set of parameters for respondents to evaluate on a scale with a range of options to choose from – and both surveys and diagnostics produce some consolidated output.
But beyond these superficial similarities, the differences are profound in every way:
These differences cover:
- Why they’re deployed – their intended purpose.
- When they’re scheduled.
- What measures they contain – where they come from and what they’re like.
- How they work in engaging people and in terms of understanding and using the insight.
- Who gets engaged, both in terms of responding and in terms of taking responsibility for what happens next.
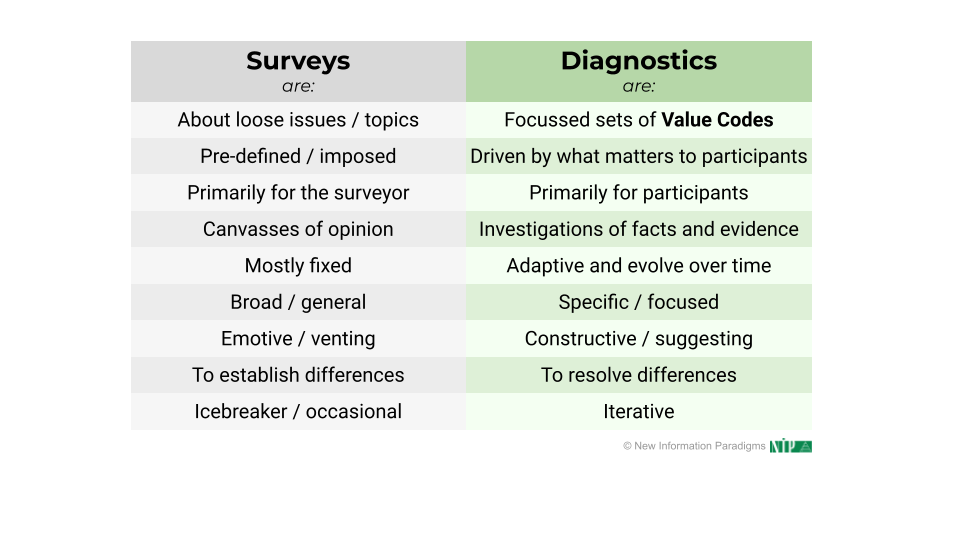
The first row of the table is pivotal:
- Surveys are typically about loose issues and topics, and are usually presented with a “breezy” 1-5 scale to quickly capture a perception.
- In direct contrast, Diagnostics are about delivering content-rich Value Codes, so they’re focussed and precise, aiming to catalyze reflection and insight around precise descriptions.
This doesn’t mean that perceptions aren’t captured in Diagnostics; far from it.
But it does mean that those perceptions are anchored in specific statements and are often explained in supporting comments (which Diagnostics encourage).
Diagnostics are therefore not just about perception; they’re also about objectivity and precision, and about joining these to perceptions – to get the best of both worlds.
And from this first distinction, all the other differences follow – especially that:
- Diagnostics emerge (or ought to emerge) from the Things That Matter to participants; this isn’t someone else’s pre-defined agenda or priorities being imposed from outside.
- Where the primary purpose of surveys is generally to gather information for whoever’s running the survey, Diagnostics are primarily to benefit the participants – indeed, Value Codes are ideally written by (or at least refined by) front-line people.
- What people are facing changes, and that means that diagnostics adapt and evolve over time – “diagnosing” is an ongoing and continuous process.
- And that means that diagnostics are also intended to be iterative; not one-off or occasional. They ought to be conceived of as part of a bigger process; never just about information gathering, benchmarking or a single point of time.
Most of all, as encapsulated in the word itself, Diagnostics are intended to lead to insight to lead to action, all led by participants.
An analogy here might help.
Imagine you’re in a restaurant to have a meal, and you’re handed the menu. It has options to choose from, yes, but you’d never consider it a “survey”. And that’s because it’s not just about perception, but involves reviewing the specifics to come to a decision by you and for you.
But what does this all look like in practice, though? How do Diagnostics “work”?
How Diagnostics work
How Diagnostics work has two aspects: their content (Value Codes) and the diagnostic process.
In both these aspects – content and process – the distinction between surveys and diagnostics is borne-out, and especially in harnessing not just perception, but also insights and clarity through the objectivity and precision that Value Codes deliver.
So let’s first look at Value Codes and how they work – particularly in the context of a Diagnostic.
Value Codes
The first thing to say here is that – unlike simple survey questions – Value Codes harmonize and balance the two broad kinds of thinking we do:
- Objective: execution-focused, narrowing-down and centered on what is already known.
- Subjective: creativity-focused, expansive and looking to new possibilities.
Both these “modes” of thought are critical.
Now, it should be said that surveys do aim to capture perceptions about specific things, so on some level they do loosely try to “combine” both these modes of thought, but they ultimately lack both the depth and contextual framing to achieve this at all effectively:
- There is very little depth in most survey content: a quick description or statement with a 1-5 (often “strongly disagree” through to “strongly agree”)
- Framing-wise, because they come from “outside” (even if the intent may be genuinely to address things that are important to the survey participants), they have a much greater chance of failing to resonate with and engage people.
(And that’s before even considering “survey fatigue”, which we’ll come back to shortly.)
In contrast, Value Codes consciously seek to optimize and harmonize insights from both:

- They flow from the Things That Matter, around which people naturally coalesce and self-organize, rather than being directed, fostering empowerment and discernment.
- Indeed, the links back to the related Things That Matter provide context – why the Value Code is there and what it contributes to – channelling thoughts and perceptions around real-life situations.
- Immediately, though, the Value Code structure and content bound and ground an aspect of the Things That Matter into something specific that “pushes” the person evaluating it for clarity around how things are and/or how they could (or ought) to be.
So, there is a conscious harnessing of both subjective thought – general perceptions, led by the Things That Matter, around how things “feel” – and objective thought, i.e. which statement most accurately and specifically captures how things “are” (or could be).
Value Codes therefore put relentless focus on the creative tension between objectivity and subjectivity – between specific and general; between current and desired states – to stimulate mindful and insightful inputs.
And that’s why comments are not only encouraged, but so readily flow – there is now a catalyst and outlet for creative and focussed thought.
With all this in mind, let’s now turn to the Diagnostic process.
The Diagnostic process
The first thing to say here is that Diagnostics naturally support evaluation, grouping related things together in sections to further help focus attention, and actively fusing subjective and objective thought:
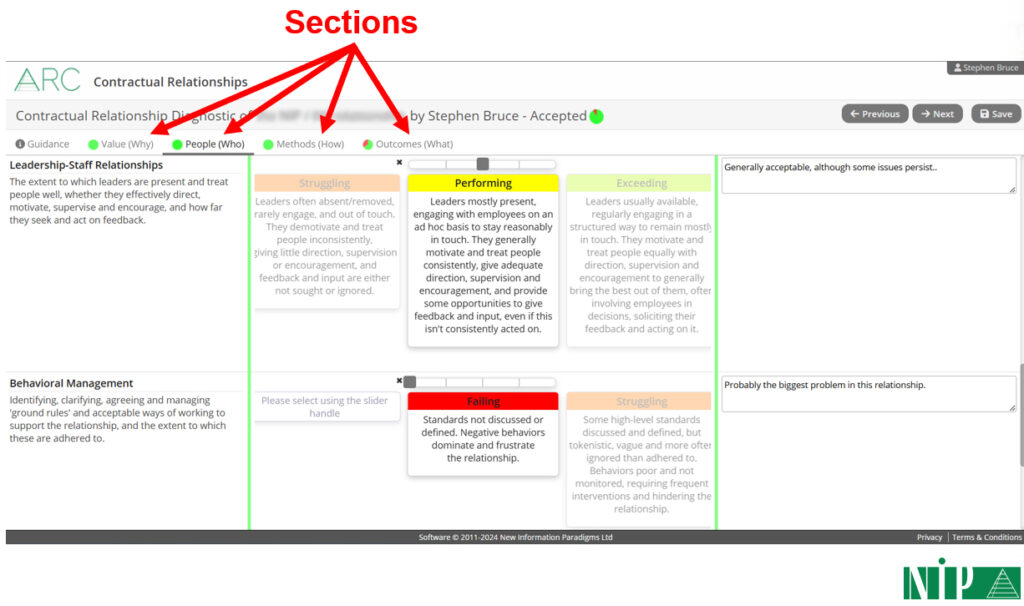
They also make evaluation clear and easy to do: labels and descriptions are on the left, evaluation statements in the middle (objective) to choose from using slider bars (subjective), and there’s then space on the right to enter comments (a combination of both subjective and objective).
But online Diagnostics are far more than just an intuitive UI; they also readily provide the kind of rich reporting needed to gain insights: overviews, more detail, and – crucially – highlighting perception gaps, e.g.:
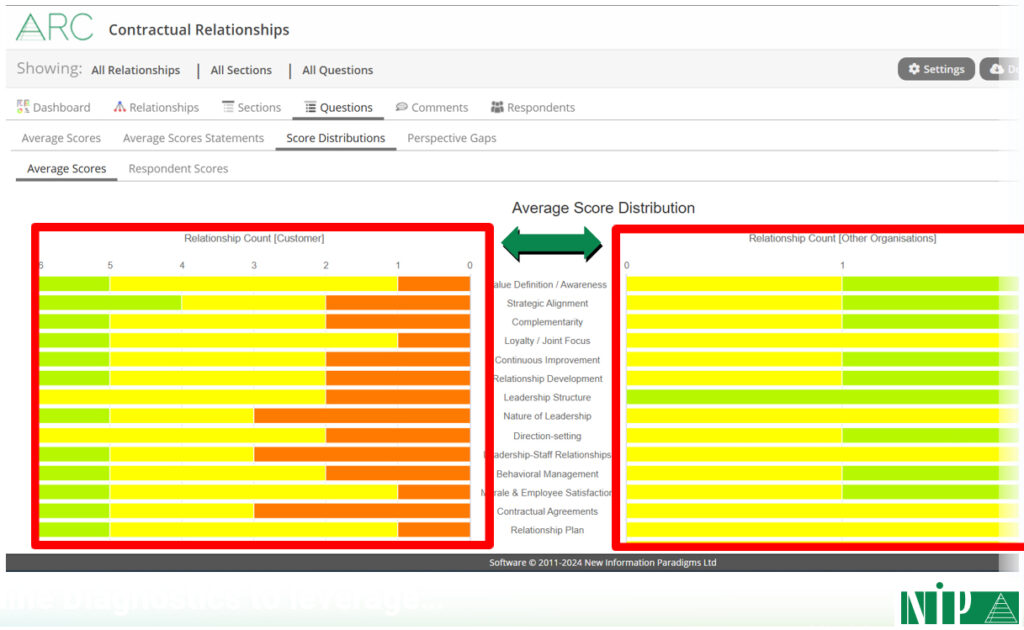
And the online Diagnostic process also provides:
- Limitless scalability to any number of participants.
- Immediacy: there are no scheduling constraints; no writing-up, processing and collating; it just happens automatically.
- Security and discretion (anonymous by default), so it’s a safe space to be completely frank: far less “confronting” (for lack of a better word) than workshops or interviews.
- Inclusivity in terms of numbers of people (beyond those that would be e.g. at workshops) and in terms of personality type (i.e. those that are more naturally introverted and/or more reflective, but who then often have the most nuanced and valuable insights).
“But“, I can possibly hear you say, “those things are all true of surveys, too: they can also involve 100s of people, they can also be anonymous, and they can also produce pretty charts!”
And you’d be right.
But that’s why you need to remember that we’re talking about process and content.
And it’s finally why you need to understand why and how this unique combination of process and content means that Diagnostic output should be used completely differently from survey output.
Unfortunately, this is where most Diagnostics currently fall down.
Using Diagnostic output
We’ve already touched on how Diagnostic output should be used in reflecting that the primary purpose of Diagnostics is to serve the participants and not whoever has instigated the process.
This firstly means that Diagnostics are entirely different types of “measurement”, so should be used for entirely different purposes and in entirely different ways:
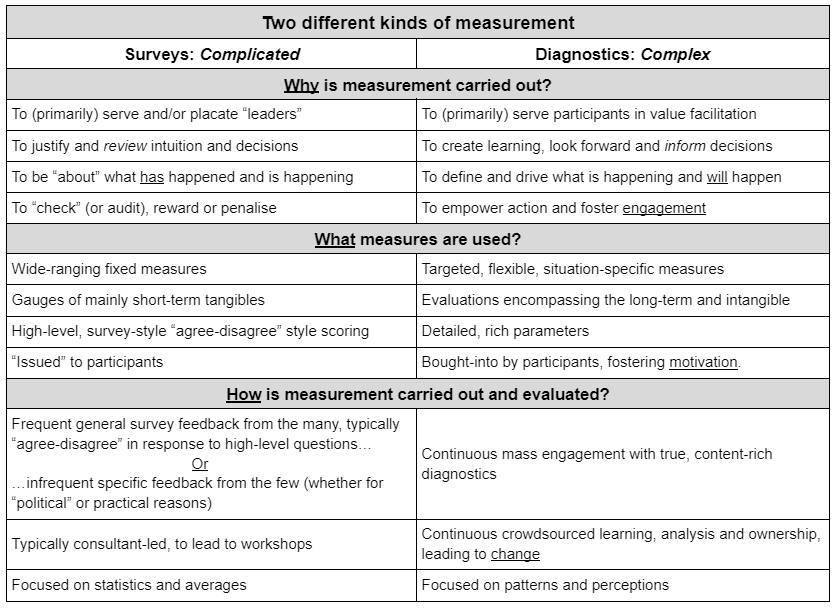
Indeed, the only thing that survey output and Diagnostic output have in common is that the worst thing you can do with both is ignore it.
Beyond that, though it’s entirely different…
…and this becomes clearer if we consider how survey output is usually used in light of what we’ve seen so far with Diagnostics.
Because if you do with Diagnostic output what is usually done with survey output, you’ll at best miss a huge opportunity; at worst, you’ll end up worse than you started – with false optimism, complacency and rushing to the lowest common denominator.
❌ DO NOT: Look to use the feedback to validate existing decisions and biases
This is where, influenced by surveys, you cherry-pick “scores” and comments to fit an existing agenda, e.g.:
- Senior management confirming what they’ve already decided to do or what they already thought were the main priorities.
- Consultants steamrollering past the feedback to deliver their standard training or workshop.
In both cases, there may be a nod to what’s been said, but having “teased” people with a new type and focus of measures, you’ve essentially done what you were going to do anyway.
You can then kiss goodbye to them engaging again: you managed to engage them this time under the guise of “this is different” (engagement at scale and/or with a radically different kind of measure); they won’t believe you a second time – at best, they’ll just tick the box as quickly as possible to give you “feedback” in future (after all, you clearly just “ticked the box” in asking them for feedback this time).
❌ DO NOT: Limit access, restrict involvement and prescribe outcomes
This again reflects a survey mentality, and takes several forms:
- Limiting who gets to see the Diagnostic’s output – e.g. presenting it just at management meetings – which lacks transparency and reinforces the idea that a privileged few are responsible for understanding where things are at.
- Similarly, restricting discussions about what happens next to e.g. workshops or board meetings, such that whilst the Diagnostic’s output may or may not be visible, only a few people get to decide what to do next.
- Centrally issuing conclusions from the exercise, e.g. in a report, a new “strategic initiative” or by implementing training.
Of course, this is what happens with surveys: the feedback is collected by whoever’s instigating the survey, it’s for them, and they get to decide what it means and what to do with it.
Most typically, this takes the form of training or “coaching” – either the exercise has revealed that those providing feedback have revealed “faults” that need to be corrected, or the issues will be resolved “in the round”, whether through:
- Workshops, which reinforce that only a few people really “matter”.
- Training, which is often pre-canned – so comes with the sense that specifics don’t matter (so what was the point of asking about them?) – and often pre-planned (at its worst, bundled in with the “diagnostic”), so was always going to happen.
In both cases, responsibility for insight and change are significantly reduced – limited to a “privileged” few, or delegated to an internal or external consultant – and insight and change are once again funnelled through traditional vehicles (workshops and training).
(Not to mention the old maxim of “insanity is doing the same thing over and over again and expecting different results“…!)
❌ DO NOT: Focus on averages and benchmarks
This is probably where the legacy of surveys is most keenly felt – after all, surveys are so light on content, numbers are pretty much all you’ve got to go on – and we then see several seriously flawed approaches.
The initial one is generating, focusing on and drawing conclusions from overall averages, whether for:
- Individual responses, e.g. “Joe Smith averaged 3.3 overall; Anna Jones averaged 3.1 overall – Joe is a more positive individual“
- All of a specific Diagnostic instance’s feedback, both overall and for specific Value Codes, e.g. “across all respondents this time, we’re at 3, so we’re doing fine; within that, for Risk Management in particular, we’re at 2.9, so we’re not doing so well there“
- Multiple instances of a Diagnostic, e.g. “10 of our suppliers completed the diagnostic this time, and averaged 2.86 overall; this time last year, the average was 2.84, so our supply chain has got better“
- Even – at its most ridiculous – entire sectors and domains, e.g. “across all pharmaceutical companies completing the diagnostic, the average is 2.87; across all tech companies, it’s 2.85… so pharma is better than tech”
Such practices totally miss the following:
- The more inputs you have, the more everything tends to the middle: differentiation becomes minimal and increasingly meaningless.
- What does a context-free average tell you in any case? What does it mean to say “you are 2.98 overall”?
- Not everything evaluated will usually be of equal importance: if the things that matter most have scored 1 and the things that matter least have scored 5, the average will still be 3, but without any sense of weighting.
Most of all, distribution is completely ignored. Ask yourself this question:
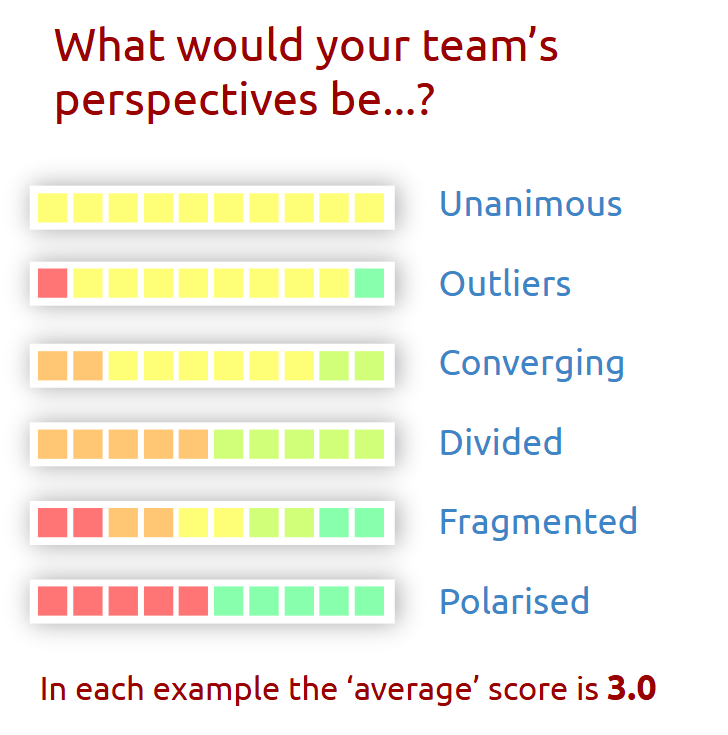
As the diagram makes clear, averages totally mask misalignment – the number one obstacle to effectiveness.
This neglect of distribution then recurs in other completely misguided and short-sighted approaches.
Perhaps the worst of these is benchmarking against other averages – either against a “neutral” best practice gauge or other organizations – which leads to false confidence and complacency.
This is especially egregious with overall averages, but even with greater fidelity – e.g. benchmarking on specific points – the same problems remain:
- How do you know that the benchmark is even relevant? What do you know about the other organizations involved in producing it?
- It ends up being significantly a rush to the lowest common denominator (“as long as we’re better than the average/benchmark/other organization, that’s the main thing“) – the prospect of being “least bad” rather than “genuinely good” is a real one; after all, the focus has become the “average” and not what is truly exceptional!
- It almost entirely ignores what matters to the end customer – the assumption is either that the benchmark contains what the customer cares about or that, regardless, customers would prefer a higher benchmark… but on what grounds are such assumptions made?
- The focus often becomes improving the average, even by tiny amounts, missing entirely that averages can go up whilst fragmentation increases (which would be a huge problem)… quite aside from how such a tiny increase is pretty much meaningless, in any case.
And benchmarking is far from the end of the problems when it comes to focussing on averages. Others include:
- Rounding averages to the nearest whole number for the sake of simplicity – we’ve seen situations where all overall averages between 2.5 and 3.49 are treated as 3, missing entirely that that’s a huge range (especially with large data sets, where everything tends even more to the middle!).
- An increased focus on the raw numerical data, e.g. to do further statistical analysis (which makes quantitative data even more the focus).
- Assuming the numerical data “speaks for itself” and neglecting any comments given, except insofar as they reinforce what the average seems to say (i.e. “dissenting” voices can be sidelined because they don’t “agree” with the “consensus”).
Now, this last point was perhaps somewhat forgivable in the past – at least when dealing with a lot of feedback, at which point 100s or 1000s of comments were undeniably harder to analyze.
However, now that we have Large Language Models that can cut through any amount of data, it would be completely negligent to disregard comments in this way.
❌ DO NOT: Draw hasty and over-simplistic conclusions
In keeping with how averages and benchmarks lack nuance and lose sight of the real, wider context, we next frequently see people jumping to over-hasty and over-simplistic conclusions from Diagnostic data.
The main one is probably to do with strengths and weaknesses, and it usually involves either or both of:
- Assuming that areas that are above average are good (whether “average” is within the specific Diagnostic exercise or a wider “benchmark”), and then either doubling-down on them or assuming no further action is needed.
- Assuming that areas that are below average are bad, and making addressing these areas the automatic priority.
The issue is again getting lost in the data, and losing sight of what is really of value:
- Might some areas scoring “low” be doing so precisely because they don’t matter – either outright or at least in relative terms?
- Might focusing on improvements in these areas then be a waste?
- Even more so, might it take focus away from those areas that most need attention?
- Or on maintaining performance in other areas?
- What if some areas are directly opposed to one another, such that focus on one has unforeseen consequences elsewhere?
As an example on this final point, imagine that process efficiency and innovation – two areas that potentially work “against” each other – have both been evaluated. Process efficiency scores “low”, so becomes a “priority”; innovation is about average, so isn’t on the radar. However, by deciding to address “problems” in process efficiency, you might accidentally hobble innovation, which could then become a far bigger problem.
And there are other ways that homing-in too fast can be problematic:
- Focusing too fast and far on specifics – especially in some sort of “we must deal with the worst areas first” way – can mean you miss patterns, e.g. looking at the structure of the Diagnostic: what if there is a cluster of issues in a specific section that hints at a more foundational problem?
- Jumping straight to improvement actions – it’s understandable you want to get something done, but with everything we’ve now seen, the risk is that you will use resources less effectively and perhaps even counter-productively.
Of course, both of these can be made worse when working to an existing standard or benchmark, which often pre-suppose the priorities and the ways to realize them.
Finally, whilst it’s a special case, it nonetheless merits inclusion as a prime example of an over-hasty and over-simplistic conclusion.
And this is where, when using a Diagnostic for anything to do with relationships – either a specific relationship, or relationships in general – you reach conclusions without getting external inputs.
How, for example, can you draw conclusions about your partnering capability, say, without asking one or more of your partners?! What do they think you’re good and bad at? What matters most to them?
You’d be surprized (or, by now, perhaps you wouldn’t be!) how often this is ignored.
Why this all matters
Diagnostics can be transformative.
They should deliver transformative content, using a transformative process – especially in terms of scale and immediacy – to reveal transformative insights.
However, as we’ve seen, Diagnostics are so often being misused: at best, this reduces their impact; at worst, it makes them counterproductive.
Because “survey fatigue” is real and people are rightly sick of surveys: they take time, there’s usually very little benefit to them (at least for participants), and nothing ever really changes.
And the main issue is in how Diagnostic output is being (mis-)used.
After all, Value Codes will have initially differentiated a Diagnostic from a survey, but if – as is so often the case at the moment – you revert to type and treat the output as you would with a survey, it’s not just a wasted opportunity.
And you’ll not just end-up with a largely shallow and incorrect understanding of the situation.
Indeed, you may well find you’d have been better off not doing a Diagnostic at all – not only will you have failed to progress towards the Alignment, Resilience and Coherence we all need; you’ll have set yourself even further back.