Great Expectations: What Happens When Reality Bites?
At best, just over a third of initiatives end up truly succeeding, and even this is probably over-optimistic; the rest only achieve marginal gains or fail altogether. This all follows a consistent pattern – the Expectations Curve – and it helps identify the pitfalls to avoid.
Over the years, we’ve observed a remarkably consistent and overlapping set of patterns when it comes to new initiatives.
(We use the generic term “initiatives” to cover projects, relationships, products – and much more besides – as the patterns are universal.)
To visually represent these patterns, we’ve created the “Expectations Curve” graphic , and it seems to really resonate with people:
- It is easy for them to understand.
- It reflects their experience.
- It helps explain what has happened in their initiative(s), what is happening now, and what may happen next.
Sadly, the current reality that the graphic depicts is one where only about a third of initiatives truly succeed.
Happily, Value Management can transform that reality, but let’s first look at how the Expectations Curve is put together and see in more detail what it shows us.
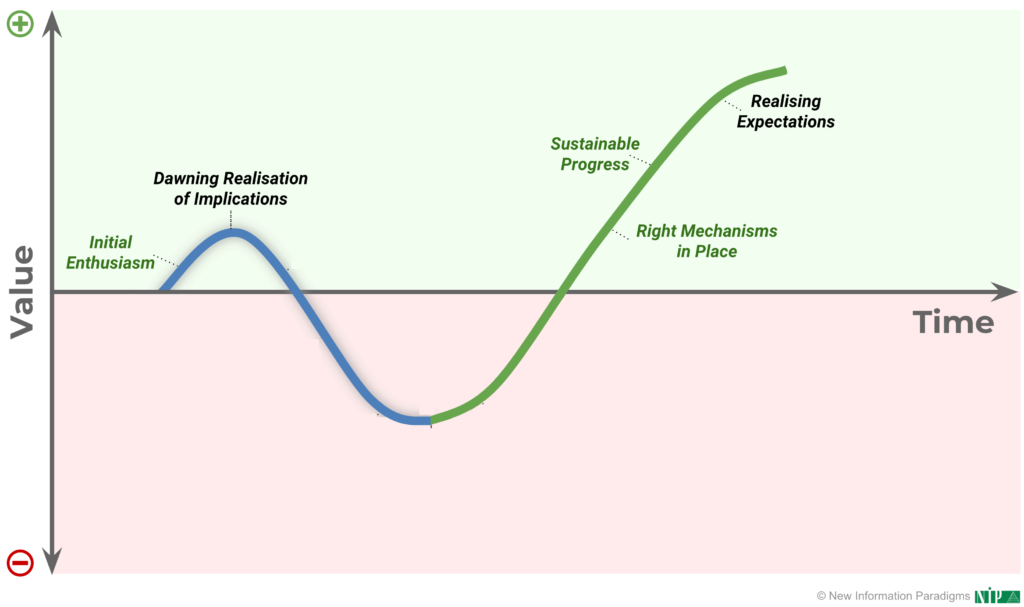
Defining the Expectations Curve
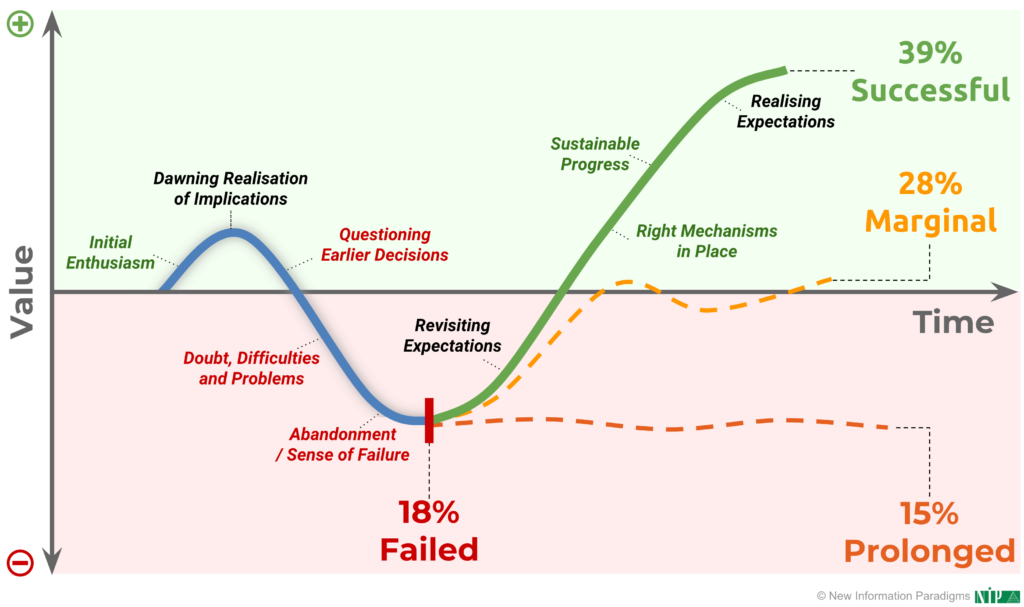
The Expectations Curve plots the different patterns – or “courses” – that initiatives can follow with axes of 1. the Value being realised (or not), as 2. they move forward through Time:
This leads to a familiar curve shape – generic examples include learning curves and bell curves; a particular example is the technology adoption life cycle – and the curve shape reflects that initiatives go through different phases or lifecycle stages.
These phases or lifecycle stages in turn reflect varying dynamics between the two variables that constitute the axes:
- There can be either increase or decrease of Value on the y-axis.
- The rate of either can vary with Time on the x-axis.
- There are inflection points throughout where the dynamics of the curve (and the initiative it reflects) change.
What makes the Expectations Curve distinct from similar curve graphics is that it maps multiple courses – the four different courses that an initiative can take.
Exploring the Expectations Curve
The Expectations Curve makes clear that any initiative can either:
- End early in failure (18%).
- Continue in failure (15%).
- End up producing marginal gains (28%).
- End up being a success (39%).
And here we encounter the most shocking truth in the Expectations Curve: almost two thirds of initiatives end without realising their expected and required value, leading to astonishing levels of waste and cost:
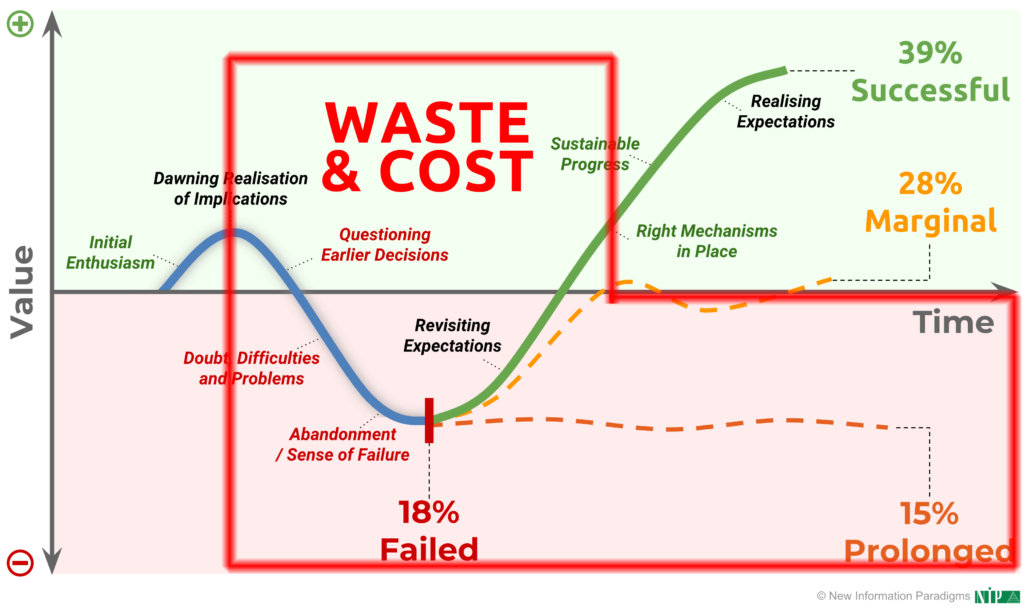
Can’t believe things are as bad as that? Look at sources from Forbes, HBR, Forbes and Project Management Works and you’ll see that – if anything – these numbers are more optimistic than warranted!
Now, at this point, a couple of things are worth clarifying:
- Some changes and dips in the curve may be inevitable: for example, there’s likely a “maximum” value that can be achieved and maintained, which sees the curve flatten even in a successful initiative.
- Some dips may even be acceptable: for example, the R&D phase in product development is likely to see a dip below the line (although this depends on how you measure value: you may well be spending more than you’re making in this example, but the valuable IP generated is increasing!).
However, the overall picture is clear and – as we’ve said – it rings true for people: most initiatives are not delivering what they should.
Why?
Hype vs Reality
The first point of “failure” is that organisations – particularly large ones – regularly fall into the same trap:
- They get caught up in (and sold on) the Initial Enthusiasm (blue up slope) part of the curve.
- They mistakenly think that they are buying into the Right Mechanisms in Place part (green up slope), usually in the form of capability development.
This combination of 1. potentially over-inflated goals, 2. confusing enthusiasm with achievability and 3. assuming that enhancing capability automatically leads to results, means that the issues and risks ‘in the middle’ are not recognised or understood.
These issues and risk then come as a huge surprise, leading to Questioning Earlier Decisions, the appearing of Doubts, Difficulties and Problems and Abandonment / Sense of Failure.
A typical example here is imposed collaborative working schemes, where organisations (again, typically large ones):
- Want the exciting benefits it can bring, but treat it much like any other product or service.
- Assume that it is – and treat it as – something that can be “imposed” and embedded via top-down and/or “centre-out” processes.
- Fail to understand that collaboration emerges from underlying conditions that need to be nurtured and fostered.
Rather than having the Right Mechanisms in Place, imposition – whether through leadership directives and/or rigorously adopting standards – will be counterproductive, and things are set up for the big fall in the curve.
(To be clear, standards absolutely have their place; the issue is when they are used in the wrong ways and at the wrong point in the curve.)
Recognising Reality
The next point of “failure” is that, for there to be any recovery from this point, initiatives need to take the step of Revisiting Expectations.
This doesn’t necessarily mean lowering the bar in terms of the value sought, but it does mean being more realistic about what’s involved and how long it might take.
However, things are often already so bad that the initiative is abandoned (18%) or it’s too difficult to rethink things, such that it continues to limp along (15%).
Otherwise, though, by diffusing things, addressing despair and finding renewed hope in this way, this Revisiting Expectations step can then on its own recover things to a “break-even” point in terms of Value x Time.
Working With Reality
However, the final point of failure is that unless initiatives put the Right Mechanisms in Place, they will at best bump along – sometimes realising a bit of value; sometimes losing a bit – but ultimately never making Sustainable Progress.
Therefore, at least relative to the value sought, this 28% of initiatives is also ultimately failing.
The key step for achieving success is therefore the Right Mechanisms in Place step, and this means not just recognising reality, but consciously working with it.
At this point, note that all of the courses mapped on the Expectations Curve show an initial dip after the first blue slope up, where expectations and plans begin to meet reality and implementation.
Is it possible to eliminate this dip altogether? Is it possible to go straight from Initial Enthusiasm to Right Mechanisms in Place? Could the curve look like this?:
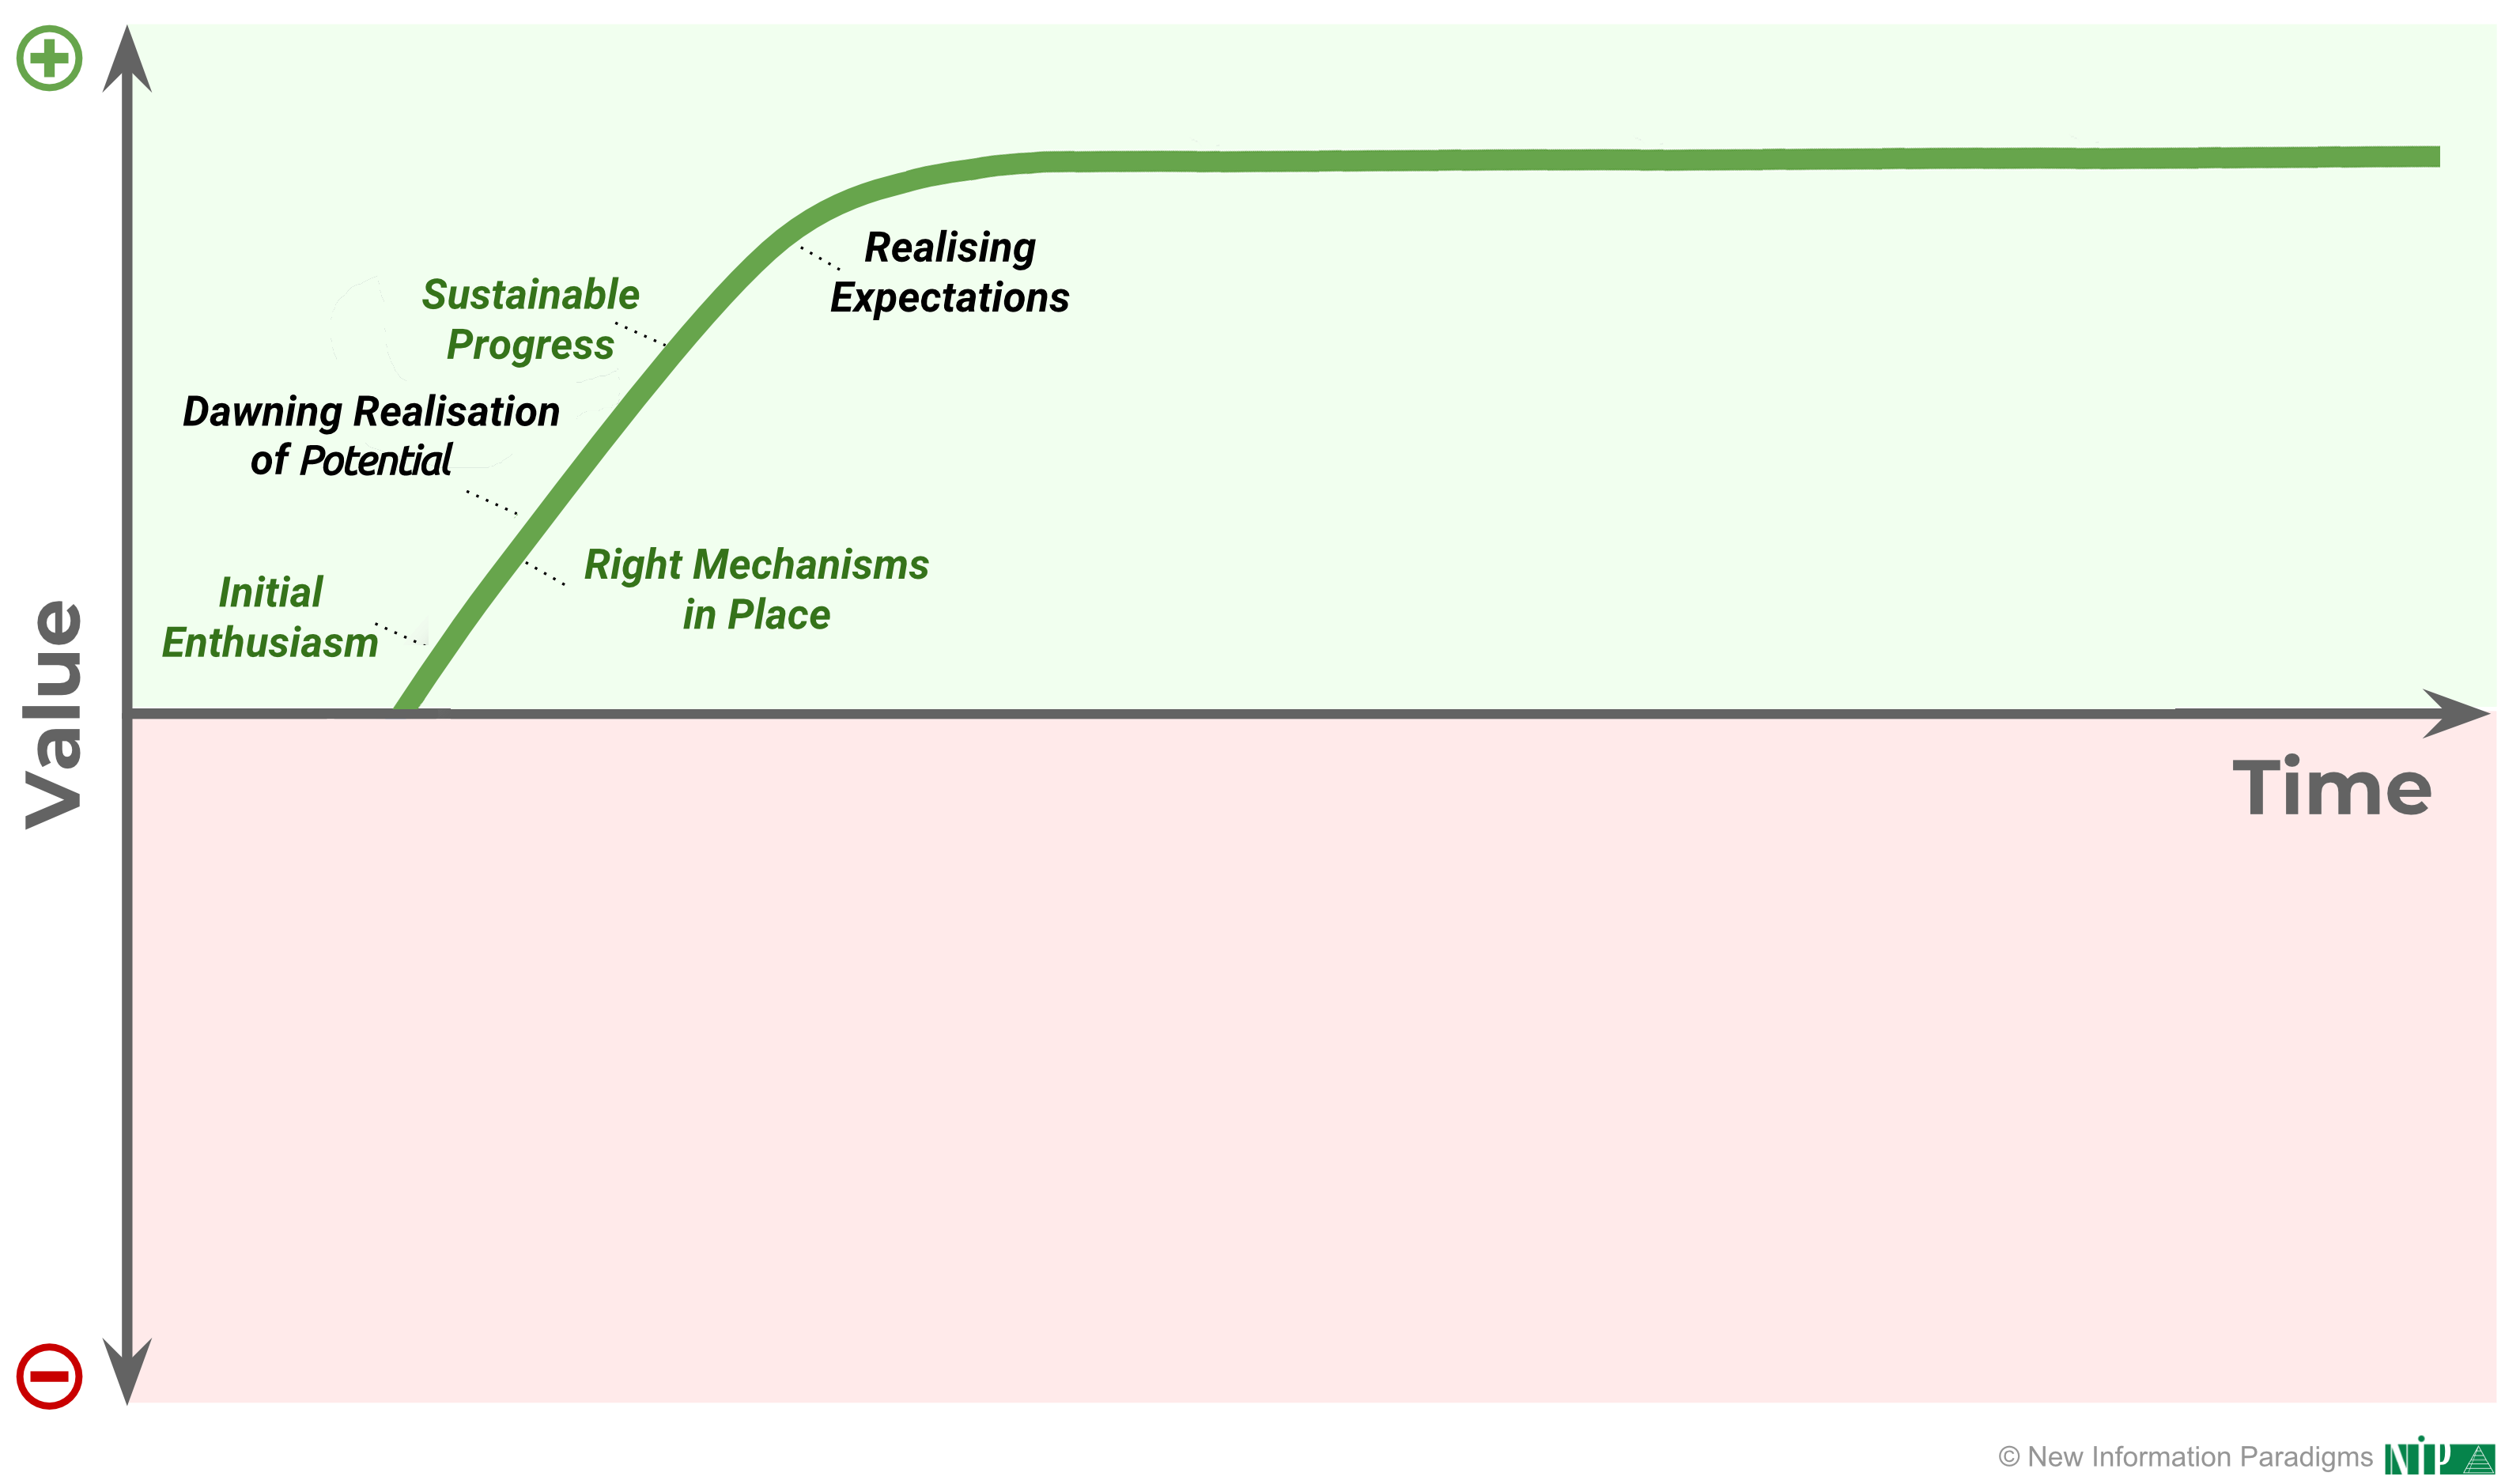
We definitely think so.
After all, Value Management is all about the two axes that map the reality shown in the graphic:
- It focuses on Value, as constituted by the Things That Matter…
- …in a process that takes Time: surfacing and understanding what those Things That Matter are, measuring them and ensuring they are delivered-on.
Value Management also recognises and works with reality – the current shock and fracture point in the curve – by embracing the fact that the world is Complex, understanding how to engage and motivate People, and focusing relentlessly on Value. This:
- Inspires Initial Enthusiasm.
- Puts the Right Mechanisms in Place .
But even if we’re wrong – and some initial dip is natural and unavoidable – the challenge would be a similar one, i.e. if not to eliminate the dip altogether, to flatten and shorten it.
And the results would still be an astonishing contrast to the status quo, with all the negative inflection points avoided:
Transformation Through Value Management
Whichever new version of the Expectations Curve proves achievable – in your particular initiative, or in general – the results will be transformative, and the approach the same: being totally clear about the Things That Matter.
To illustrate by returning to our collaboration example, that would mean consciously progressing with the Things That Matter as follows (using the different Perceptual Positions):
- Being clear about the Things That Matter to you.
- Establishing the Things That Matter to the other party or parties
- Seeing authentic collaboration – where the shared Things That Matter, and those that matter to each of the parties, are all in focus – naturally then emerge.
Clearly articulating, openly sharing and regularly evaluating the Things That Matter therefore makes it possible to consciously and dynamically “manage” the journey along the curve:
- Being clear about what the curve (usually) looks like.
- Consciously taking steps to anticipate, prepare-for and identify inflection points
- Avoiding the pitfalls, at least as far as possible.
- Minimising any slopes down.
- Maximising the slopes up.
This is Value Management in action, where engaged and motivated individuals, teams and organisations all focus-in on, address and realise the value of the Things That Matter.
How to start?

